How to Remove PFAS From Water: Judge Destruction Technology by Performance Data, Not Mechanism

If you have already decided that destroying PFAS beats capturing it, the next question is not which mechanism is best. It is which technology actually performs. Two systems can share the same scientific principle and still deliver completely different results on real water. The reliable way to tell them apart is a short set of performance metrics you can request as raw data. This guide lays out those metrics and turns them into a checklist you can send to any vendor.
This is the follow-up to our earlier guide on choosing between PFAS removal and destruction. That article settled the category question. Here we assume the category is settled and move to vendor-level evaluation.

Why "How to Remove PFAS From Water" Is the Wrong Framing
Most searches start with removal, but removal and destruction are not the same outcome, and the word you use shapes what you buy.
Removal Moves the Problem; Destruction Ends It
Activated carbon, ion exchange, and reverse osmosis concentrate PFAS into a spent medium or a reject stream. The compounds still exist and still need final handling. Destruction breaks the carbon-fluorine bond and converts PFAS into inorganic products, which means there is no loaded medium to landfill or incinerate afterward. If your goal is to eliminate liability rather than relocate it, destruction is the category to evaluate.
This Guide Assumes Destruction Is Already Chosen
Because the removal versus destruction decision is covered in the prior article, we do not repeat it here. From this point on, every metric assumes you are comparing destruction technologies against one another, not against filtration.

PFAS Water Treatment Claims: Why Mechanism Alone Tells You Nothing
A convincing mechanism is the price of entry, not a differentiator. Sonolysis, electrochemical oxidation, plasma, and supercritical water oxidation all have published pathways for cleaving carbon-fluorine bonds.
Every Credible Technology Has a Plausible Pathway
The peer-reviewed literature already documents the underlying chemistry. Vecitis et al. (2008), writing in The Journal of Physical Chemistry A, described how acoustic cavitation converts aqueous PFOA and PFOS into inorganic products, and a meta-analysis by Sidnell et al. (2022) in Ultrasonics Sonochemistry pooled roughly thirty studies to confirm that ultrasound can mineralize PFAS. A sound mechanism, in other words, is common. It does not predict how a specific reactor performs at your concentration, your flow rate, and your water chemistry.
Performance Data Is the Real Differentiator
What separates vendors is measured output on representative water: how much of each compound was destroyed, whether the fluorine was actually released, and what it cost in time and energy to get there. Those numbers are what the rest of this guide asks you to collect.

The Performance Metrics That Actually Evaluate PFAS Destruction
Ask for these eight data points. Each one closes a gap that a mechanism description leaves open.
Short-chain versus Long-chain Destruction Rates
Long-chain compounds such as PFOA and PFOS are easier to destroy than short-chain replacements such as PFBA and PFBS. A headline destruction rate measured only on PFOS can hide poor performance on the short-chain compounds that dominate many modern waste streams. Request the rate per compound, not a single blended figure.
Fluoride Ion Release: The Mass-Balance Proof of Mineralization
This is the metric most often missing from a vendor deck, and it is the one that proves the claim. If PFAS is truly mineralized, the fluorine leaves the molecule and appears as fluoride ion in solution. A high destruction number with low fluoride recovery suggests the parent compound was only transformed into shorter-chain intermediates, not eliminated. Vecitis et al. (2008) framed complete conversion in exactly these inorganic-product terms, so defluorination ratio is a fair and rigorous thing to demand.
By-product Formation
Incomplete destruction can generate shorter-chain PFAS or other fluorinated intermediates. Ask whether the vendor screened for these and what they found. A technology that lowers the target compound while raising unregulated intermediates has not solved the problem.
Total Organic Carbon Change
TOC reduction is a second, independent check on how far the reaction went. It captures organic load that compound-specific PFAS analysis can miss and helps confirm that destruction, not dilution or transfer, drove the result.
Energy Consumption
Energy per unit of water or per gram of PFAS destroyed is where lab elegance meets operating cost. Two systems with identical destruction rates can differ by an order of magnitude in energy, and that gap decides whether a pilot ever becomes a plant.
Treatment Time
Batch time and throughput determine whether a technology fits a continuous industrial process or only a small batch demonstration. Ask for the time to reach the destruction level quoted, not just the level itself.
Real Wastewater Applicability
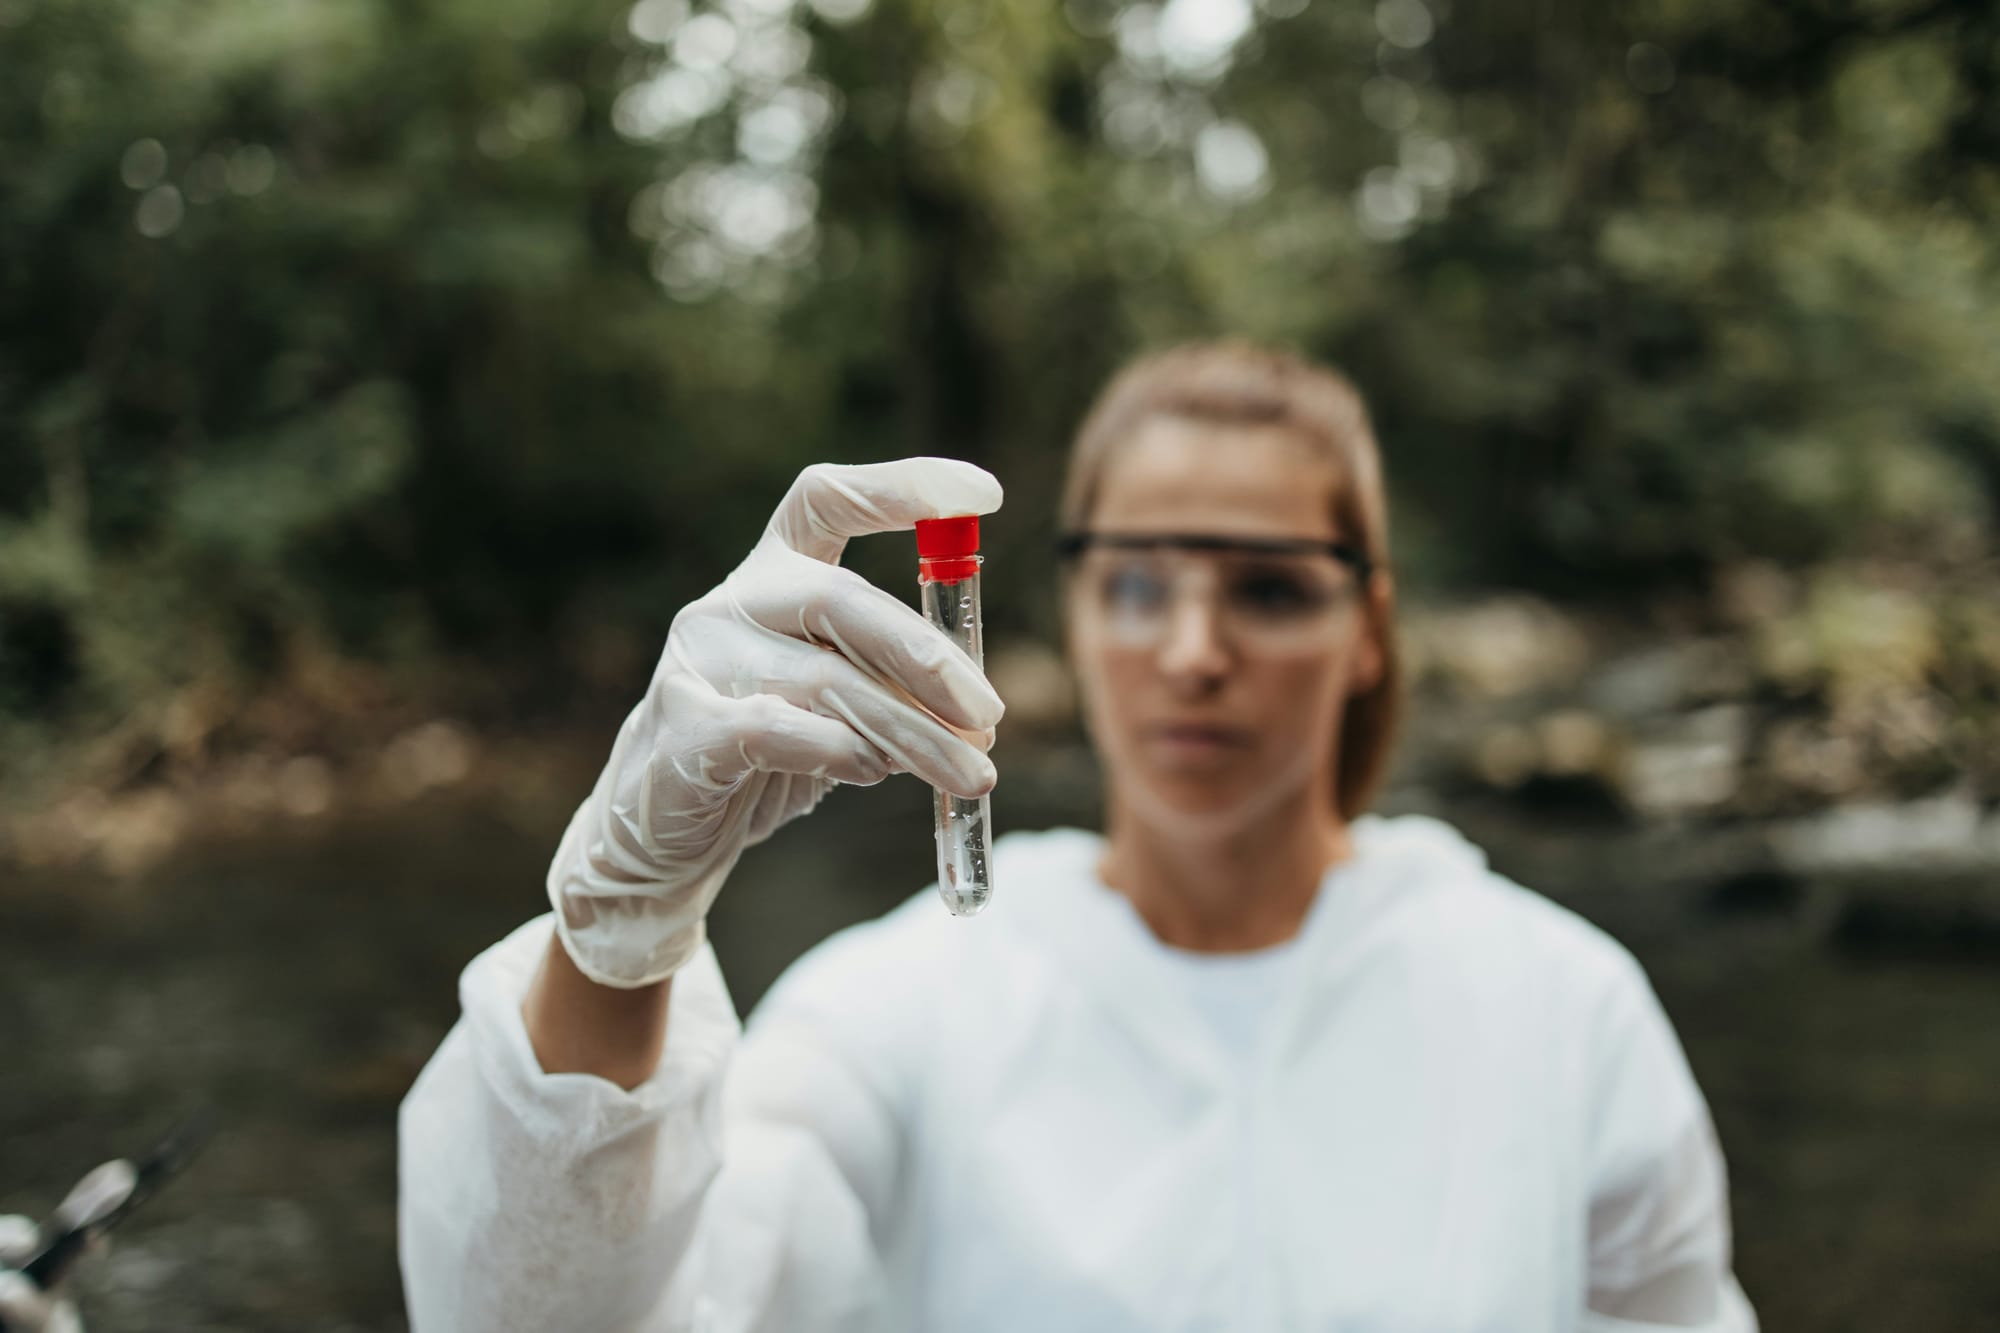
Clean spiked water and real effluent behave differently. Co-contaminants, organic matter, and salinity all compete for the reactive species that destroy PFAS. Meegoda et al. (2025), reporting in Environmental Science and Pollution Research, tested a multi-frequency reactor on genuinely complex matrices including groundwater, industrial wastewater, and firefighting foam, which is the kind of evidence that matters here. Lab-only data is a starting point, not a validation.
Independent Validation
Finally, ask who generated the numbers. Third-party or accredited-laboratory results carry more weight than internal testing alone, and independent replication on your own water sample is the strongest signal a vendor can offer.

The PFAS Vendor Evaluation Checklist
Send this list to any destruction vendor and read the completeness of the reply as its own signal. A vendor who can answer all eight with data is a different proposition from one who answers three and reframes the rest.
| Data Point to Request | What a Strong Answer Looks Like |
|---|---|
| Destruction rate per compound | Separate figures for long-chain and short-chain PFAS |
| Fluoride ion release / defluorination ratio | High fluoride recovery consistent with the destruction claim |
| By-product screening | Named intermediates checked, with results |
| TOC change | Independent reduction confirming mineralization |
| Energy consumption | Energy per volume or per gram destroyed |
| Treatment time | Time to reach the quoted destruction level |
| Real wastewater test | Data on matrices resembling your stream |
| Independent validation | Third-party or accredited-lab results |
How to Read the Answers You Receive
Watch for a common pattern: a strong single-compound destruction number presented without fluoride data, without by-product screening, and without a real-matrix test. That combination usually means the technology performs well in a narrow lab condition and has not been proven where it counts. The absence of a metric is information.
Frequently Asked Questions
How do you evaluate a PFAS destruction technology?
By requesting measured performance data rather than accepting a mechanism explanation. The core metrics are per-compound destruction rate, fluoride ion release, by-product formation, TOC change, energy use, treatment time, real wastewater applicability, and independent validation.
What does fluoride ion release tell you?
It is the mass-balance proof that PFAS was mineralized rather than merely transformed. When the carbon-fluorine bond breaks, fluorine appears as fluoride in solution, so a destruction claim without matching fluoride recovery is incomplete.
Why does short-chain versus long-chain PFAS matter?
Short-chain compounds are harder to destroy and increasingly common in waste streams. A destruction rate measured only on long-chain PFOS can overstate real-world performance.
Does laboratory performance predict real wastewater results?
Not reliably. Co-contaminants and water chemistry change the outcome, which is why testing on complex, representative matrices is a separate and necessary criterion.
The Bottom Line
The question is not how a PFAS destruction technology works. It is whether the vendor can show you eight specific data points on water that resembles yours. Mechanism explains the promise. Performance data tells you whether the promise holds.
References
- [A-4] Vecitis, C. D., et al. (2008). "Kinetics and Mechanism of the Sonolytic Conversion of the Aqueous Perfluorinated Surfactants, PFOA and PFOS, into Inorganic Products." Journal of Physical Chemistry A, 112(18), 4261–4270. Read the paper ↗
- [A-1] Sidnell, T., et al. (2022). "Sonolysis of per- and polyfluoroalkyl substances (PFAS): A meta-analysis." Ultrasonics Sonochemistry, 87, 105944. Read the paper ↗
- [A-5] Meegoda, J. N., et al. (2025). "Ultrasound for degradation of complex matrices of PFAS mixtures." Environmental Science and Pollution Research, 32(41), 23645–23666. Read the paper ↗